The Ishikawa Diagram, also known as the fishbone diagram or cause-and-effect diagram, is a powerful tool for identifying root causes of problems in various industries, including medtech. Named after its inventor, Dr. Kaoru Ishikawa, this diagram visually organizes potential causes of a specific problem, helping teams analyze and address underlying issues systematically. In the medtech industry, where precision, compliance, and innovation are paramount, the Ishikawa Diagram can streamline problem-solving processes in areas like product development, manufacturing, quality assurance, and customer satisfaction.
Understanding the Ishikawa Diagram
The Ishikawa Diagram resembles the skeleton of a fish, with the problem or effect as the “head” and potential causes branching off as “bones.” Each bone represents a category of causes, such as personnel, processes, materials, equipment, environment, or methods. Teams brainstorm and categorize potential causes, creating a visual map that simplifies complex problems and highlights areas requiring investigation.
Table of Contents
For medtech companies, this structured approach is invaluable in identifying factors that may compromise device performance, regulatory compliance, or patient safety.
Here’s a comprehensive spreadsheet format for creating an Ishikawa Diagram with actionable tips. This layout includes the necessary steps, descriptions, and practical tips for each step to make the process easier and more effective.
| Step | Description | Actionable Tips | Examples |
|---|---|---|---|
| 1 | Define the Problem | – Clearly state the effect or issue you’re analyzing. – Keep it concise and focused. | Example Problem: “Device fails biocompatibility tests.” |
| 2 | Identify Main Categories | – Use common categories (e.g., Materials, Methods, Environment, Equipment, Personnel). – Customize categories for relevance. | For medical devices: Materials, Testing Procedures, Equipment, Regulatory Standards, Personnel, Environment. |
| 3 | Brainstorm Potential Causes | – Involve a cross-functional team to gather diverse insights. – List possible causes under each category. | Under “Materials,” list: “Non-compliant coatings,” “Supplier issues,” “Use of substandard materials.” |
| 4 | Organize Causes on the Diagram | – Use the fishbone structure: place the problem at the head and categories as branches. | Draw the diagram manually or use tools like Lucidchart, Microsoft Visio, or online Ishikawa diagram generators. |
| 5 | Investigate and Validate Causes | – Collect data to verify each listed cause. – Eliminate improbable causes based on evidence. | Validate “Non-compliant coatings” by reviewing supplier certifications and testing results. |
| 6 | Prioritize Causes | – Rank the remaining causes by impact and likelihood. – Focus on addressing high-priority causes first. | Use a ranking system, e.g., High, Medium, Low, for each cause. |
| 7 | Develop Corrective Actions | – Create actionable steps to address root causes. – Assign responsibilities and deadlines. | If “Improper sterilization” is a root cause, implement training for personnel and update sterilization protocols. |
| 8 | Monitor and Review | – Assess the effectiveness of corrective actions. – Update the diagram if new causes emerge. | After implementing changes, monitor compliance rates and repeat testing to confirm resolution. |
| 9 | Communicate Findings | – Share the final Ishikawa Diagram with stakeholders. – Use it as a reference for similar issues. | Present findings in team meetings or quality assurance audits. |
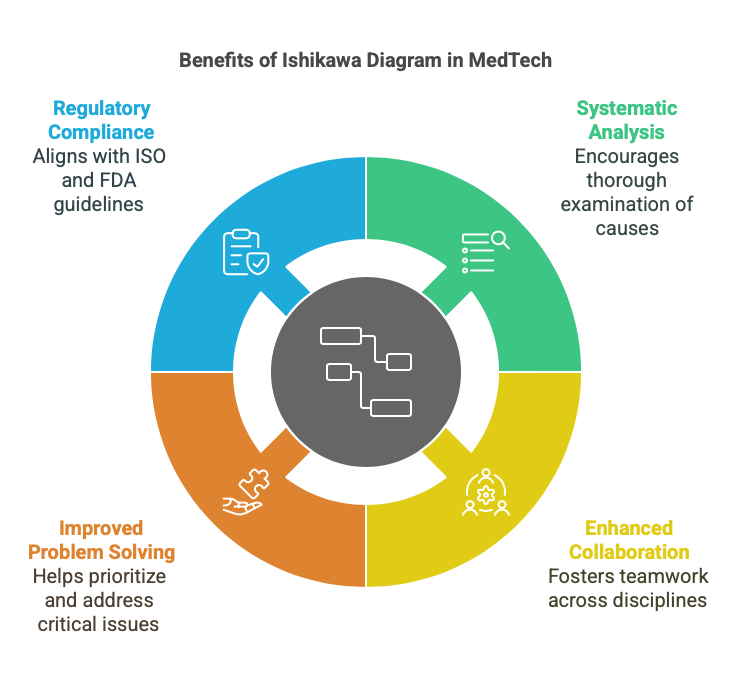
Benefits of Using the Ishikawa Diagram in MedTech
- Systematic Root Cause Analysis:
The diagram encourages a thorough examination of all possible causes rather than jumping to conclusions. This is critical in medtech, where overlooking a minor issue can have major repercussions. - Enhanced Collaboration:
Creating an Ishikawa Diagram fosters teamwork and cross-functional collaboration, ensuring insights from engineers, designers, clinicians, and quality assurance professionals are incorporated. - Improved Problem Solving:
By categorizing potential causes, the diagram helps prioritize investigations, allowing teams to address the most critical issues efficiently. - Regulatory Compliance:
Identifying and addressing root causes aligns with ISO 13485 and FDA guidelines, which require a robust approach to risk management and quality assurance.
Applications of the Ishikawa Diagram in MedTech
1. Product Development
Medtech products must meet stringent performance and usability standards. The Ishikawa Diagram helps pinpoint design flaws or functionality issues during development.
Example:
For a wearable health monitor experiencing inconsistent readings, the diagram might reveal causes such as:
- Materials: Faulty sensors.
- Methods: Inadequate calibration procedures.
- Environment: External interference during testing.
By visualizing these factors, the development team can focus on refining sensor quality and improving testing protocols.
2. Manufacturing Process Optimization
In medtech manufacturing, consistent quality is non-negotiable. The Ishikawa Diagram can identify root causes of defects, delays, or inefficiencies.
Example:
A production line producing inconsistent dimensions in a surgical instrument could use the diagram to investigate:
- Equipment: Misaligned machinery.
- Personnel: Insufficient operator training.
- Processes: Lack of standardized inspection steps.
Addressing these causes could involve retraining staff, calibrating equipment, and implementing rigorous quality checks.
3. Regulatory and Quality Assurance
Medtech products must comply with strict regulatory requirements. The Ishikawa Diagram assists in identifying factors contributing to non-compliance or quality failures.
Example:
For a device failing biocompatibility tests, potential causes could include:
- Materials: Use of non-compliant coatings.
- Methods: Inadequate sterilization procedures.
- Processes: Errors in supply chain documentation.
The team can then investigate and address each category, ensuring future compliance.
4. Addressing Customer Complaints
Customer feedback often highlights hidden issues in medtech products. The Ishikawa Diagram helps translate complaints into actionable insights.
Example:
A diagnostic device generating false positives may result from:
- Personnel: Lack of training for end users.
- Environment: Improper storage conditions.
- Equipment: Sensor degradation over time.
This analysis can lead to improved user manuals, stricter quality control, or enhanced durability testing.
How to Create an Ishikawa Diagram for MedTech Challenges
- Define the Problem:
- Clearly state the effect or issue being analyzed. For example, “Device malfunction during clinical trials.”
- Identify Main Categories:
- Use standard categories (e.g., Materials, Methods, Equipment) or customize them to suit the problem.
- Brainstorm Potential Causes:
- Involve cross-functional teams to gather diverse perspectives.
- List potential causes under each category.
- Analyze and Prioritize:
- Review the diagram to identify the most likely root causes.
- Prioritize causes based on their impact and likelihood.
- Test Solutions:
- Implement corrective actions for high-priority causes.
- Monitor results to confirm resolution.
Real-World Example: Using Ishikawa Diagram in MedTech
A medtech company developing a portable ventilator encountered reliability issues during testing. Using an Ishikawa Diagram, the team identified the following:
- Materials: Inferior tubing causing leaks.
- Methods: Improper assembly techniques.
- Environment: Variability in testing conditions.
- Equipment: Inconsistent calibration of pressure sensors.
By addressing these root causes—sourcing better tubing, training assembly workers, standardizing testing conditions, and recalibrating sensors—the company improved the device’s reliability and avoided delays in regulatory approval.
Best Practices for Using the Ishikawa Diagram in MedTech
- Involve Cross-Functional Teams:
Include representatives from design, manufacturing, QA, and clinical teams for a comprehensive analysis. - Focus on Data-Driven Insights:
Support potential causes with data to avoid subjective or biased conclusions. - Iterate and Refine:
Regularly revisit the diagram as new information emerges during testing or production. - Integrate with Other Tools:
Combine the Ishikawa Diagram with tools like Failure Mode and Effects Analysis (FMEA) for deeper insights.
Conclusion
The Ishikawa Diagram is an invaluable tool for identifying root causes in the medtech industry. Its structured approach simplifies complex problem-solving, ensuring issues are addressed efficiently and comprehensively. Whether in product development, manufacturing, quality assurance, or addressing customer feedback, the Ishikawa Diagram provides clarity and direction. By leveraging this tool, medtech companies can improve product quality, accelerate time to market, and ensure compliance with regulatory standards.
At OVA Solutions, we specialize in helping medtech companies optimize their processes and deliver innovative solutions. With expertise in hardware development and quality management, we can support your team in implementing tools like the Ishikawa Diagram to tackle challenges effectively. Ready to transform your medtech operations? Contact us today!